 Fragmentation occurs when energetically unstable molecular atoms dissociate (either through homolytic or heterolytic cleavage) as they pass through the ionization chamber of a mass spectrometer. Here, the sample is bombarded with a stream of electrons powerful enough to remove an electron from the sample and form a positive ion (also called molecular or parent ion).
Since molecular ions (symbol = M+) are not energetically stable, they usually break into a positive ion and uncharged free radical. These positive ion fragments will be detected by the mass spectrometer and form a corresponding line on the stick diagram. On the other hand, the uncharged particle will simply be removed through the vacuum pump.
However, there are times when fragmentation occurs in the ion source (known as in-source fragmentation). This is not the ideal case since ion source conformation is considered an important criterion in mass spectrometry techniques.
Fragmentation Reactions
Generally, fragmentation can take place via the following processes:
- Sigma bond cleavage. This refers to the process wherein an alpha electron is removed upon the elongation and weakening of the C-C bond. This type of cleavage produces a charged particle and a neutral particle.
- Radical site-initiated cleavage. This occurs when a radical cation pairs with an odd electron and migrate to form a bond between the alpha carbon and the heteroatom or unsaturated functional group, causing the cleavage of the sigma bond.
- Charge site-initiated fragmentation. Also known as inductive cleavage, this type of fragmentation occurs when electrons from an adjacent bond migrate to a charged atom. This reaction then neutralizes the charge of that atom and causes it to move to another site.
- This refers to fragmentation reactions that lead to the formation of new bonds and the production of an intermediate structure prior to cleavage (e.g., McLafferty rearrangement, Heterocyclic ring fission, benzofuran forming fission, QM fission, and retro Deis-Alder or RDA reaction).
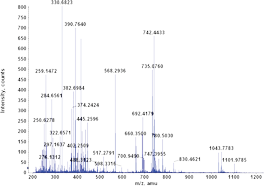
When a molecular ion is fragmented, each of the fragments will show up as a series of lines in the mass spectrum, providing an all-important clue to the molecular structure of the compound.
In analyzing the spectrum, special attention should be given to the base peak and the molecular ion peak. The base peak is extremely easy to identify since it is the largest peak in the spectrum. Considering the fact that ions exhibiting greater stability are more likely to form and that the amount of a particular kind of ion formed determine the peak height, it follows that the base peak represents the most abundant fragments in the sample.
On the other hand, the molecular ion peak represents an analyte molecule that has not undergone cleavage. This is also of great importance since it provides the molecular weight of the compound and can be used as a reference in identifying other fragments.
However, identifying all peaks in a mass spectrum is next to impossible so utilizing a few diagnostic fragment ions and GC retention times can help in identifying and/or confirming the identity of the sample being analyzed.
Identifying Molecular Fragmentation Patterns in Mass Spectrometry
A molecule’s structure can give you an idea of what peaks will be seen in the mass spectrum. By simply looking for the pieces that are most likely break to produce stable cations, you can easily identify the molecular fragmentation patterns that will eventually be observed in the spectrum.
For example, alkanes break apart to produce the most highly substituted cation. Now, since tertiary cations are more stable than secondary and primary cations, they are more likely to produce the largest peaks in the spectrum.
The spectra of straight chain alkanes generally consists of clusters of fragments separated by 14 amu (due to differences of CH2 groups), with the largest peak representing an alkyl radical cation (CnH2n+1) while branched alkanes have weak molecular ion peaks (which may sometimes be absent), more stable secondary and tertiary carbonium ions, and more fragmentation at highly branched positions. Cycloalkanes have relatively large molecular ion peak, with a significant peak at M-28 due to loss of ethylene.
Molecules containing heteroatoms (e.g., oxygen, nitrogen, and sulfur) usually break to form resonance stabilized cations. This type of break (i.e., alpha cleavage) is commonly observed in alcohols, amines, and ethers.
Additionally, alcohols are known to readily lose a water molecule to form an alkene. With the exception of benzyl alcohols, these compounds have weak M+ peak and a prevalent M-1 peak. Upon cleavage, they produce resonance stabilized cations due to the breakage of the β bond and show a prominent peak at m/z 31. Note: Secondary and tertiary alcohols can undergo a rearrangement to show a peak at m/z 31.
Different compounds produce distinct patterns so we’ll touch more of that in another article.