 Basically, spectrophotometry is one of the most widely used analytical procedures in biochemistry. It is commonly used to estimate the level of an analyte in solution and is ideal for simple routine determination of small quantities of materials. This method is based on the two laws of light absorption by solutions, namely Lambert's Law and Beer's Law.
Understanding the Beer-Lambert Law
Lambert's Law states that "the proportion of light absorbed by a medium is independent of the intensity of incident light" while Beer's Law maintains that "the absorbance of light is directly proportional to the concentration of the absorbing medium and the thickness or path length of the medium".
Lambert's Law is expressed as:
Transmittance (T) = Intensity of transmitted light (I)/Intensity of incident light (Io)
where transmittance is the ratio of the amount of light transmitted to the amount of light that initially fell on the surface.
On the other hand, Beer's Law is expressed as:
Absorbance (A) = Extinction coefficient or Molar absorptivity (e) x Concentration (C) x Path length (L)
where absorbance is the negative logarithm of transmittance.
Taken together, these laws allow us to use different spectrophotometers with different light sources and still produce comparable absorption readings. In addition, these laws also give us the ability to measure samples of different path length and compare the results directly with each other.
Protein Applications of Spectrophotometry
Since proteins absorb light at a specific wavelength, a spectrophotometer can be used to directly measure the concentration of a purified protein in solution. It is important to note that direct UV measurement at 280 nm yields highly reproducible measurements since no reagents are added to the protein solution and the protein of interest was not modified or inactivated during the process. It also produces quick results since the sample does not need to be incubated in order to complete the process.
The chemical composition of the protein (i.e. the number and type of amino acids present) will affect its absorption. Since a sample protein's absorption at 280 nm will depend on the amount of the amino acids tyrosine and tryptophan, it is very much possible that proteins of similar molecular weight will have different absorbance values due to their different tyrosine and tryptophan content.
In addition, the structure of your protein of interest may also affect the UV absorbance of aromatic side chains. As such, the temperature, pH, ionic strength, and/or the presence of detergents can affect the ability of aromatic residues to absorb light at 280 nm, and change the value of the protein’s extinction coefficient.
Calculating Protein Concentrations
To compute for the concentration of a purified protein in a solution, the following formula can be used:
Concentration (μg/ml) = A280 x Conversion Factor
Note: Each protein has its own conversion factor. Use the A260/A280 ratio to check for the purity of your protein sample.
Alternatively, you can also compute for the protein concentration using the following formula:
Concentration (μg/ml) = A280 /Absorbance coefficient (E280,1mg/ml) x l)
Note: The absorbance coefficient varies between proteins and can be determined either by measuring the absorbance of the protein in a solution of known concentration, or by theoretical calculation.
The presence of nucleic acids in your protein sample may affect the accuracy of your measurements but you can still estimate the concentration of protein in your sample regardless.
C (mg/ml) = 1.55 × A280 - 0.76 × A260
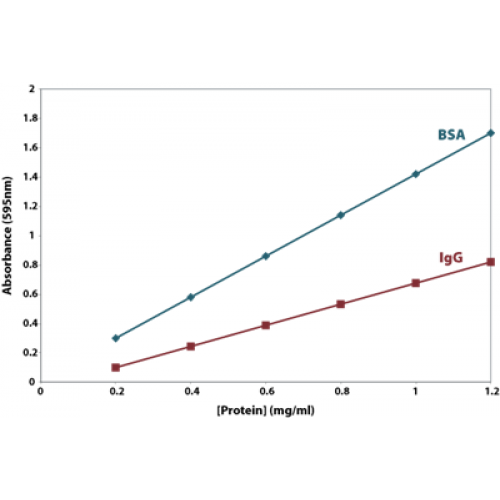
A wide variety of colorimetric methods can also be used to measure protein concentrations. The BCA, Bradford, Lowry and Biuret methods all work in a similar fashion but you may need to choose the most appropriate protein assay method to suit your application.