The traditional method for calculating protein concentration of an unknown sample is to use a standard curve that is generated from known protein standards.
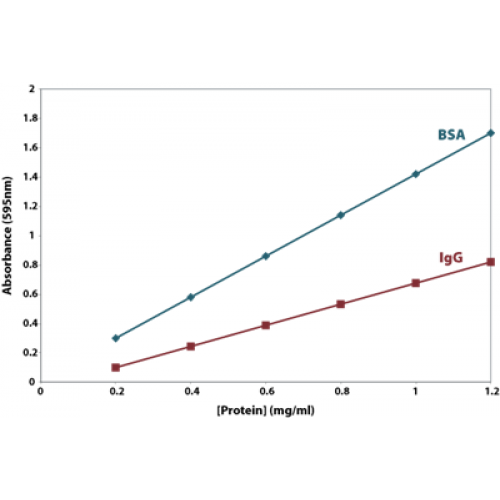
The most reliable protein estimation is performed using a reference or a protein standard that has properties similar to the protein being estimated. Often, it is difficult to find a protein standard with similar properties to the sample being analyzed. As a result, it has become acceptable to use readily available proteins such as bovine serum albumin (BSA) and gamma globulin as standards. Using either the BSA or the bovine γ-globulin (IgG) as reference proteins, Bradford protein assays do show significant protein-to-protein variation; hence, the calculated result is an estimation of protein concentration.
A key point to remember is that identically assayed samples are directly comparable. This means that unknown samples and standards that are treated identically are directly comparable in terms of protein estimation. As a result, it is highly recommended to use the same buffers that your unknown samples are in for the generation of your standards.
How to generate protein standards?
Below is a simple table for the generation of your standards. As a general rule of thumb, use at least 6 standards for generating the standard curve and adjust the dilutions of standards to cover the expected range of your unknown samples. More importantly, stay within the linear range of your protein assay.
The buffer of choice should be the same buffer your unknown protein standards are prepared that way you are comparing like to like (apples to apples as opposed to apples and oranges).
Always include a blank of just the Buffer of Choice!
| Tube # | Standard (µl) | Buffer of Choice (µl) |
Final Concentration (mg/ml) |
Final Volume (µl) |
| 1 | 500µl of Starting 2mg/ml standard | 0 | 2 | 500 |
| 2 | 750µl of Starting 2mg/ml standard | 250 | 1.5 | 750 |
| 3 | 500µl of Starting 2mg/ml standard | 500 | 1 | 500 |
| 4 | 250µl of Tube #2 Standard | 250 | 0.75 | 500 |
| 5 | 500µl of Tube #3 Standard | 500 | 0.5 | 500 |
| 6 | 500µl of Tube #5 Standard | 500 | 0.25 | 500 |
| 7 | 500µl of Tube #6 Standard | 500 | 0.125 | 1000 |
| 8 | - | 500 | 0 | 500 |
Alternatively, you can purchase pre-diluted protein standards.
What are the units for my protein concentration?
The simple adage is: “Units in =Units Out”
In the table above, the units of the protein standards is mg/ml, which is the same as µg/µl, so your unknown standards concentration will be defined as mg/ml or µg/µl. In some cases, the standard curves are displayed with just µg of protein. G-Biosciences’ Bradford Assay, CB™ Protein Assay, uses 50µl of protein standard. So, the µg of protein for the standards would be:
Volume of Protein Standard (ml) x Starting Protein Concentration= Amount of protein (mg)
0.05 x 2=0.1mg or 100µg
| Tube # | Final Concentration (mg/ml) | Amount of Protein (µg) |
| 1 | 2 | 100 |
| 2 | 1.5 | 75 |
| 3 | 1 | 50 |
| 4 | 0.75 | 37.5 |
| 5 | 0.5 | 25 |
| 6 | 0.25 | 12.5 |
| 7 | 0.125 | 6.25 |
| 8 | 0 | 0 |
The above table is shown to help lessen the confusion when standard curves or protein assays are performed based on the amount of protein; however, most researchers want to know the amount of protein in their sample, not the amount of protein in the assay tube or well. So, it is critical to always generate standard curves based on their starting concentrations.
How to Apply Dilution Factors
Most commercial assays will express the linear range of the assay, the range over which the assay is accurate. You should ensure that your unknown sample is within that linear range. If you know your sample is greater than the linear range, or if after performing an assay is outside the linear range, then you would need to dilute the sample.
For example, if the unknown sample is expected to have a concentration of 5mg/ml and the linear range of your assay is 0.1-1mg/ml, then the unknown sample needs to be diluted 10 fold so it is in the middle of the linear range. A 10-fold dilution would be 1 part unknown sample to 9 parts buffer of choice, or 100µl unknown sample added to 900µl buffer of choice.
Perform the assay and calculate the standard (see below). The result should be around 0.5mg/ml. To calculate the concentration of the undiluted, unknown sample, simply multiply by the dilution factor. So, 0.5 x 10= 5mg/ml.
Protein Standard Curve or Linear Plot
A common question is should you use a linear plot or a curve (a curvilinear regression). The two images below show the variations seen with a linear plot and a 3 parameter polynomial equation.


The blue lines show the purely graphical basis of a point to point curve and for an unknown sample with absorbance of 0.6 gives a protein estimation of ~0.42mg/ml.
Many researchers, for convenience, plot a linear regression for the set of standards as they assume the overall relationship between the standards is best described by a linear relationship (R2=0.9791), which is rarely seen. The red line in the Linear Plot figure shows the linear plot and the equation for this line is y=1.0736x + 0.0677. Solving for x (the protein concentration) for an absorbance of 0.6 gives:
x=(y-0.0677)/1.0736, so x=0.495mg/ml
As you can see by the Linear plot number above, a linear regression does not provide a good method for comparing the protein standards to the unknown samples; however it is a convenient method, providing a rough estimation.
For a more accurate estimation, and a feature of many new spectrophotometers and plate readers, is to use a curvilinear regression. The equation of the above curve is:
y = 0.0735x3 - 0.6928x2 + 1.6993x - 0.0082 and to solve for x is 0.425mg/ml, a more accurate estimation.
Helpful Hint
If you do not have the spectrophotometers or plate readers that can do the above calculations for you then here’s how to use Microsoft Excel.
- In column A place the Known protein concentrations of the standards
- In column B, add the corresponding absorbances
- Select both columns and from the insert menu select an XY Scatter chart.
- Click on the corresponding chart and add a trendline. Choose polynomial and set the order to 2, 3 or 4 to achieve the best fit.
- Make sure to select Display equation on the chart.
- Use the resulting equation to calculate the protein concentration (x) from know absorbances.
Standard curves are always plotted as the Standards on the x-axis and absorbances on the y-axis, however to make solving the polynomial equations easier, plot absorbances on the x-axis and protein concentration on the y-axis. Now simply plug the absorbances (x) into the polynomial equation and solve for y (Protein concentration).