The fundamental source of all processes in living system is force. Force is required to maintain the balance between the external and internal environment of any living system. Cells have the ability to sense and respond to the forces. Cells perform different activities such as migration and interaction with extracellular ligand. While performing all these vital functions required of normal development and maintenance of homeostasis, cells perform a myriad of feedback mechanisms in order to adjust with the mechanics to correlate with the physiological needs of the cell. Hence, in a nutshell, cells have a dynamic reciprocation of exertion and resistance force to tune with the material properties of the extracellular matrix and help to assert physical interactive forces with the neighboring cells or with the extracellular milieu. Consequently, it is essential to measure these cellular forces to understand different functions and properties of the cell. Cellular forces are not evenly distributed in space and vary according to the substrate. When cells are cultivated on a specific substrate, especially when grown in-vitro, the forces, also known as cell traction forces, are exerted by the cells at localized regions known as focal adhesion sites which is subsequently attributed to the physical properties of the cell and the substrate interaction.

Figure 1 Cell traction forces (CTFs) on an Extracellular matrix surface (Source: R.H. Gavin (ed.), Cytoskeleton Methods and Protocols, Methods in Molecular Biology, vol. 586)
Several methods have been developed to measure cell traction forces both in a quantitative and qualitative manner for example, thin silicone membrane, microfabricated cantilevers, micropost force sensor arrays, and traction force microscopy (TFM).The most promising technique to measure cellular forces is Traction force microscopy (TFM). In TFM, quantification of cellular forces is done by monitoring surface tractions imparted by the cells on the flexible substrate. As cells do not release mechanical force signals which can be quantified and analyzed without the contact with the substrate, hence TFM gives an advantage over atomic force microscopy.
What is Traction Force Microscopy?
Traction force microscopy is one of the most successful and promising techniques for force probing in cellular system. It offers a wide range of advantages, including monitoring cell tractions, analysis of parameters and turnover rates at spatio-temporal scale (short time scales of milliseconds to large length scales of micrometers). These properties help in drawing a comprehensive picture of a cell's mechanical properties and force quantification in living systems. TFM is better than atomic force microscopy (AFM) in terms of implementation, a wider range of flexibility to mimic cellular environment, and an elaborate analysis system.
In the general protocol of TFM, the cells are allowed to interact with a super thin elastic hydrogel (for example, Polyacrylamide gel) by attaching to the protein functionalized or activated surface. The hydrogel comprises of immobilized fluorescent beads that act as a reliable markers of positional changes. Imaging of the relative position of the beads over a temporal scale in either two-dimensional or three-dimensional frame during the experimental set up allows the cellular traction to be quantified on a temporal and spatial scale. This information in combination with the mechanical properties of the hydrogel helps to cells to recover from the applied forces.
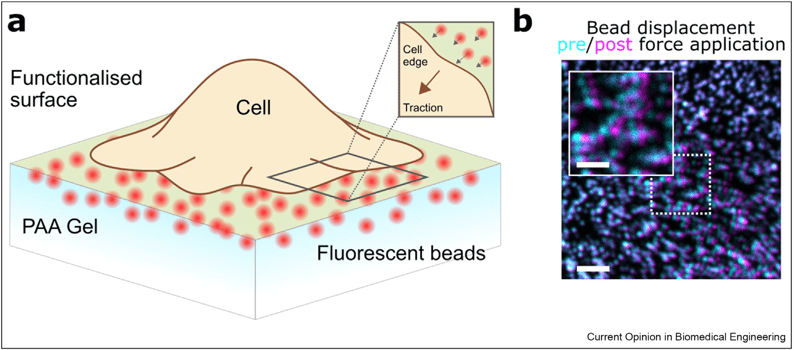
Figure 2: a) Representative outline of traction force experiment. Traction forces are quantified by imaging the displacement of the adhered fluorescent beads present within PAA (polyacrylamide) gel. b) Representative confocal images showing displacement of bead positions before (Cyan) and after (magenta) after the application of traction force. " The future of traction force microscopy- Huw Colin-York and Marco Fritzsche, Current opinion in biomedical engineering, 2018."
General Procedure of TFM
Step 1: Activating Glass Surface: Before coating the dishes with the hydrogel, the glass-bottomed Petri dish must be clean thoroughly in sodium hydroxide solution (0.1 M) followed by air drying. Subsequent washes include 0.5% glutaraldehyde in PBS and then with copious amount of deionized water.
Step 2: Fabricating Hydrogel Substrate: A degassed mixture of acrylamide/bis-acrylamide (acrylamide, 5%; bis-acrylamide, 0.1%) is mixed with a certain amount of fluorescent microbeads (typical volume ratio: 80/1 for 0.2 mm beads and 200/1 for 0.5 mm beads), 40 ml APS, and 4 ml TEMED. The solution is used to cover pretreated glass-bottomed Petri dish and placed upside down at 4°C to allow the fluorescent beads to settle down on the surface of the cover glass under the influence of gravity. After ensuring the polymerization, the gel disk is taken out from the dish gently and washed extensively.
Step 3: Conjugating Type I Collagen to hydrogel: The surface of the hydrogel is first activated using a photo-linker, Sulfo-SANPAH (Makarchuk et al (2018)), under ultraviolet (UV) light. After subsequent washes with PBS, collagen type I solution (100 mg/ml) is added on the activated hydrogel and incubate overnight at 4°C. Before cell seeding, the hydrogel is washed thoroughly with PBS.
Step 4: Measurement of hydrogel thickness: The ideal gel thickness of TFM experiments is 70–120 mm which is calculated by using the formula: the gel volume/the gel area. Otherwise, the thickness is calculated by microscopy-based method which involves relative focusing of embedded beads at the bottom and top surface of the hydrogels. The thickness is determined by the difference of these two positions.
Step 5: Cell seeding on a hydrogel substrate: Generally, 2,000–5,000 cells are seeded on a 35 mm diameter of collagen-coated hydrogel disk. Calculated cell suspension is added onto the dish and allowed to get adhered for 6 hrs.
Step 6: Image acquisition of Cell and Fluorescent Bead: First a phase contrast image of the selected area of cells is taken followed by a fluorescent image of the microbeads, referred as “force-loaded” image. Once the media is aspirated, the cells are removed by trypsinization and the image of the fluorescent beads is taken as “null-force” image. The images are computed by FEM code (ANSYS 8.0, or AMPS) to analyze the traction force.
Applications of Traction force microscopy:
- Determining Traction Forces of Individual Cells.
- Detecting Cell Differentiation and polarity.
- Determining Traction Forces of Cells with Controlled Shapes.
- Determining Traction Forces of a Group of Cells.
- Understanding cell migration and the modulus of migration at different substrates.
- Understanding cell adhesion mechanisms.
Limitations of TFM:
- It does not allow intracellular interrogation of the cells for e.g., viscosity, or stiffness of cells.
- It has limited sensitivity and resolution due to the finite density at which the relative positional shift can be sampled.
Download the protein crosslinker handbook to find appropriate crosslinkers for traction force microscopy