In a previous blog article, we discussed western blotting technique and advancement in Western blot detection using fluorescence, not only fluorescence allows detection of multiple protein bands on the same blot (multiplexing) but is a more sensitive and reliable method of detection. The linear dynamic range of chemiluminescence is 10 times smaller than Fluorescence. This blog article focuses on one of the most useful and widely used applications of Western blotting, the quantitative western blotting. Quantitative western blotting combines western blotting with digital image analysis and allows molecular cell biologists to measure and quantify changes in protein abundance and modifications (Proteolysis and post-translational modifications).
Very often cell biologists would quantify the changes in abundance of a protein in context to a given response or phenotype using quantitative western blotting. Changes in protein abundance can occur in a variety of conditions such as cellular growth and differentiation, in response to a trigger such as a chemical/physical stimulus or an immunogen, cell division, certain disease states.
Western blotting is a powerful technique but vulnerable to errors because western blotting workflow has multiple variables, therefore it is important to understand the key variables and factors to avoid pitfalls of incorrect quantification and erroneous results. We will discuss each of the key factors one by one.
- Variation in Lysis of biological samples affect protein quantification: Since quantitative western blotting is used to quantify the protein abundance in samples, it is very important to confirm the efficient solubilisation and extraction of target proteins because partial or less than optimum extraction of target proteins can lead to erroneous interpretations in the quantification of proteins. The lysis buffer should be chosen very carefully.
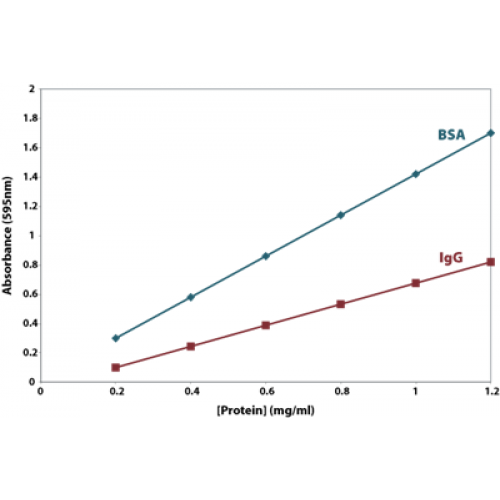
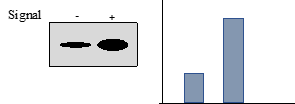
- The dynamic range of detection: Proteins can vary in biological samples over a wide range of concentrations; it is, therefore, important to choose methods and equipment that can allow for a wide dynamic range of detection (Figure 1A and B). For example, using photographic films for quantification of proteins is a bad choice, photographic films don’t allow quantification of proteins because the dynamic range of detection on film is very narrow and quantitative analysis will give erroneous results. Films can make subtle differences in abundance appear as large differences in band intensity. Moreover, films tend to get easily saturated making it difficult to capture sample-to-sample variations in high-abundance proteins such as loading controls (See figure 1C). Digital quantification of proteins using software allows a wide dynamic range of detection and quantification. Similarly, fluorescence detection provides a wider linear dynamic range than chemiluminescence, it has 10 times the linear dynamic range of chemiluminescence, therefore, quantification using fluorescent detection provides a realistic quantification of proteins and thus a true picture of the biology.
 Created with BioRender.com
Figure 1: (A). Diagram showing protein bands on a western blot corresponding to a linear and non-linear range of detection. Too much of protein on blot saturate the membrane (PVDF or nitrocellulose) and the signal intensity reaches a hyperbolic trend as shown in (B) when a substantial increase in the amount of protein doesn’t increase the signal intensity correspondingly. (C) The amount of cellular lysate loaded is a critical factor and has a major effect on the detection of proteins. (D) Amount of lysate required for detection and quantification of each protein, target or loading control protein, needs to be empirically determined and a midpoint on the linear range should ideally be chosen.
- How much protein to load? It is a usual practice to load anywhere between 50-100ug of protein extract or lysate in each well of SDS-PAGE gel, however, we at G-Biosciences don’t recommend this practice because proteins vary in their cellular abundance and hence accurate quantification of proteins requires adjustments in the amount of lysate loaded. A standard curve of protein load versus band density should be performed for each protein before performing quantitative western blotting.
- How to optimize Loading controls: The proteins on blot are quantified by analyzing the density of protein-bands by band densitometry. For a successful quantitative immunoblotting experiment, the band intensity of target protein/s in samples is normalized to some common protein which is assumed to be unaffected (in quantity or abundance) across the samples. Such proteins are usually high abundance proteins such as cytoskeletal proteins (actin or tubulin) or house-keeping proteins (HKPs). HKPs are abundant proteins and would saturate the membranes if wells are loaded with 50-100 µg protein, a quantification of band intensities of such oversaturated bands for HKPs or loading control (see Figure 1C and D) would lead to incorrect quantification and this may lead to major errors in protein quantification.
Molecular biologists are now becoming more apprehensive of the fact that choosing a single protein as loading control can lead to erroneous results for quantitative western blotting. This is a familiar problem with microarray and quantitative PCR where the perils of single variable normalization have long been recognized. Therefore, a consensus is emerging that more than one protein should be included as a loading control and band densities from multiple loading controls should be aggregated, thus calculating a mean score of total cellular content which provides a more robust method of quantification. An alternative strategy often employed is to do ‘lane-densitometry’ where densitometry for the entire lane is done for the loading control normalization.
More and more attention is now being dedicated to understanding the factors that can create serious issues in quantification of proteins in quantitative immunoblotting and which in turn can lead to loss of reproducibility in experiments, some of the key factors have been explained in this blog article and should be useful for scientists who perform quantitative western blotting. We recommend that by applying due diligence and attention to details one can circumvent issues like gross errors of quantification and reproducibility. As they say it “the devil is in details.”